Use case
Money explainers with the math shown, not just said
Personal finance is full of rules people half remember. A video that shows the math once, clearly, gets saved and shared.
Write the idea and one worked example with real numbers, and our AI shows each figure as you say it: a count-up for the result, a comparison for two rates, a line graph for growth over years. The gallery's rule-of-72 explainer does it in 19 seconds with a trustworthy older narrator.
The example, and the script it came from
- Vertical 9:16
- 19 s
- Voice: Bill
- Captions: karaoke
This is the whole script that went in. Everything else (the narration, the pictures, the graphics and the captions) our AI made from it.
Here's the rule of 72. Divide 72 by your interest rate, and you get the years it takes money to double. At 6%, that's 12 years. At 9%, it's 8. Small rates, given time, do big things.
The example: the rule of 72
A vertical explainer narrated by Bill with karaoke captions: "Here's the rule of 72. Divide 72 by your interest rate, and you get the years it takes money to double. At 6%, that's 12 years. At 9%, it's 8. Small rates, given time, do big things."
The rule, two worked examples and the takeaway, in five sentences.
Show the working
- 1
Here's the rule of 72.
A notebook and a calculatorTitle card: The rule of 72 - 2
Divide 72 by your interest rate, and you get the years it takes money to double.
Coins stacking up - 3
At 6%, that's 12 years.
A calendarComparison: 6% → 12 years - 4
At 9%, it's 8.
A growing plantComparison: 9% → 8 years
Graphics for money
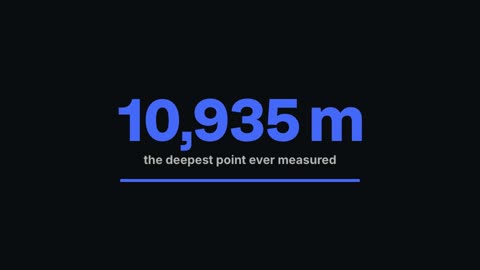
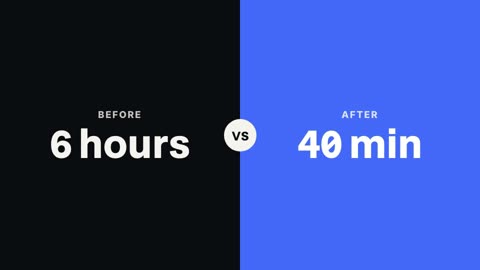
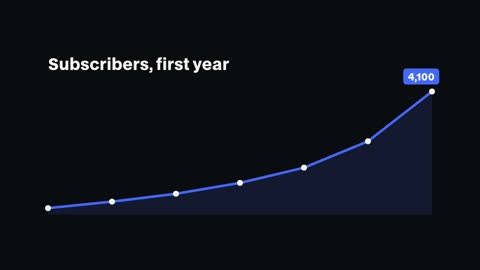
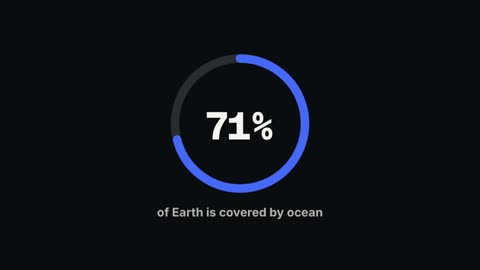
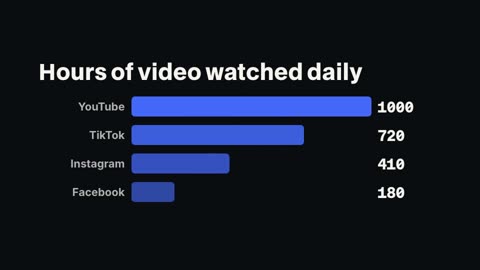
A count-up for a total, a comparison for two options side by side, a line graph for a balance over time, a progress ring for a savings goal and a top-5 countdown for lists of mistakes or habits. They take the video's accent colour, so a channel keeps one look.

Writing money scripts that read well
- One rule or idea per video; a series beats a lecture
- A worked example with round numbers people can check in their head
- Percentages and amounts in digits, so they count up on screen
- A takeaway line to end on, the part people quote in the comments
- Explain, don't promise: say what the math does, not what someone will earn
A faceless finance channel
Most finance explainer channels never show a face: a voice, the numbers and a clean look. Keep one narrator and one picture style, make vertical explainers for Shorts and longer landscape ones for YouTube, and use the same chart colours throughout.
Good series ideas are the rules people search for: the rule of 72, the 50/30/20 budget, compound interest, an emergency fund, what an index fund is. Each is one video with one worked example, and each links naturally to the next.
Questions
Can it show calculations on screen?
Yes. Numbers in the script become count-ups, comparisons and charts; you can check and correct every value in the scene editor.
Which voice suits finance content?
A calm, trustworthy narrator: Bill (older, trustworthy), Daniel (British, authoritative) or Rachel (calm, clear).
Can I make long videos too?
Yes, up to 15 minutes in 16:9 for YouTube, or vertical Shorts from the same scripts.
Can I keep my channel's colours?
Graphics take the video's accent colour, so set it once and every chart and card matches.
Which plans include it?
Every paid plan: Pro $20 a month, Studio $50, Max $100.
Keep reading
- Data videosTurn statistics into a video: counting numbers, bar charts built from your figures, a line graph for the trend and a narrator who makes the point.
- Charts and countersNumber counters that count up, bar chart races, line graphs, progress rings and comparisons. Type the numbers and drop the chart into your video.
- Faceless YouTube videosWrite the narration and our AI makes the faceless video: a picture for every line, a narrator's voice, motion graphics and captions, up to 15 minutes.
- YouTube script templateA fill-in YouTube script template for long videos and Shorts: the hook, the promise, chapters, the payoff and the close, with real examples of each part.
- Mystery videosTell an unsolved story the way mystery channels do: a low narrator, one eerie picture per beat, slow camera moves and captions that land each line.
Updated 29 October 2026
Make your next video
Upload a video or paste a script, then say the edit. Our AI makes it on a timeline you can still change.
Try for free