Ours
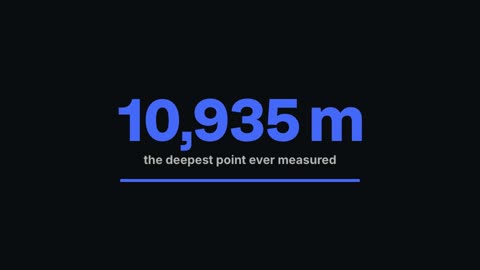
Count-up stat
A big number that counts up, what it means, and a bar that fills.
16:9 · 4 s · You change: number, what it isTemplates
Numbers that count up and bars that grow, so the point lands before the sentence ends.
A number said out loud is forgotten; a number that counts up on screen is remembered. These templates turn the figures in your video into motion: type "17%" or a few "Label: number" pairs, and the counter, bar chart or line graph draws itself.
Open Graphics in the editor to change any of them, see it play, and render it into your video.
A big number that counts up, what it means, and a bar that fills.
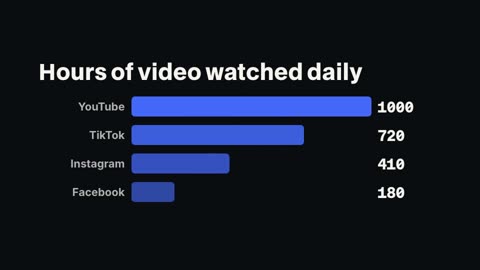
16:9 · 4 s · You change: number, what it isBars that grow together, each value counting up with it; a bar named for a colour (red, blue…) is that colour.
16:9 · 5 s · You change: title, bars (label: number, one a line)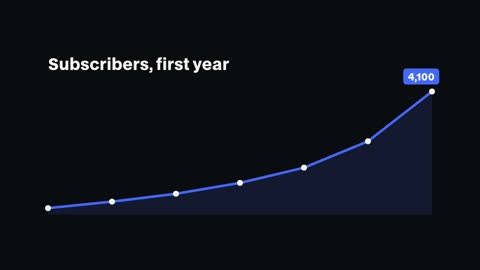
A line that draws itself across the values, dots popping as it goes.
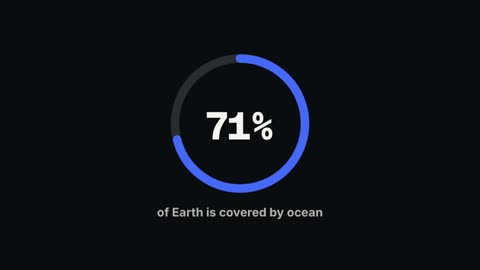
16:9 · 5 s · You change: title, values, in order (one a line), label on the last pointA ring that fills to a percent while the number in it counts up.
16:9 · 4 s · You change: percent, what it is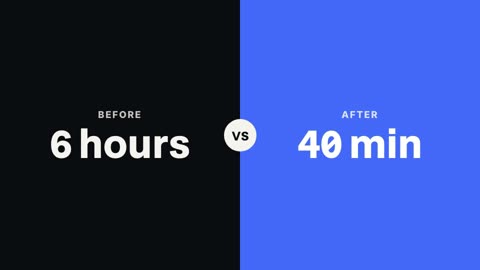
Two sides with their numbers, split down the middle: before and after, us and them.
16:9 · 5 s · You change: left side, left number, right side, right number
A big rank that rolls down to number one, with what each one is.
16:9 · 6 s · You change: from number one down (one a line)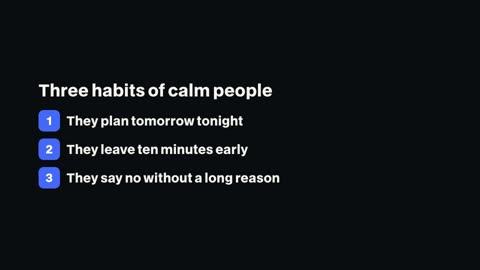
Items that build one by one, each with its number.
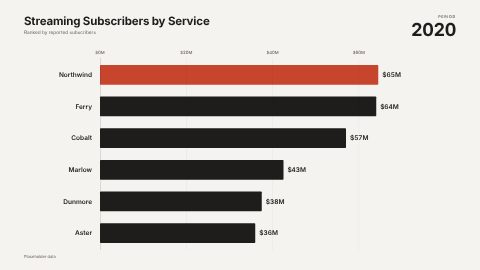
16:9 · 5 s · You change: title, items (one a line)Ranked bars grow and overtake each other as a time series advances, with the axis rescaling as values climb and the accent handing over to whoever leads
16:9 · 12 s · You change: period caption, period, source, title…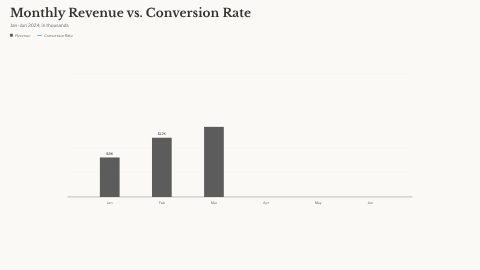
Animated bar + line chart with staggered reveal, NYT-style typography, and value labels
16:9 · 15 s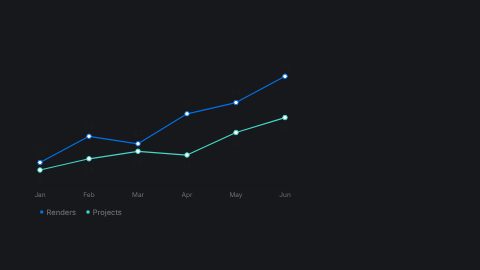
One or two SVG series draw on with dots popping and value labels riding the draw front; dim baseline axis, x-labels, color-dot legend
16:9 · 7 s
Big-numeral statistic with count-up, label, thin progress track filling to value/max, and caption; light and dark schemes
16:9 · 7 s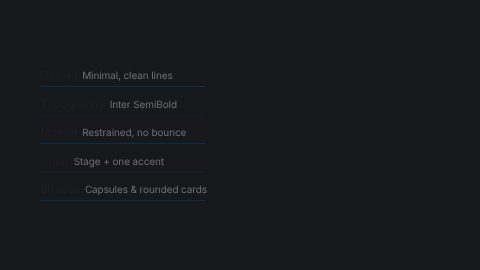
Left-aligned specs/traits checklist over footage or a board: rows slide in staggered with an accent underline sweep; light and dark schemes
16:9 · 8 s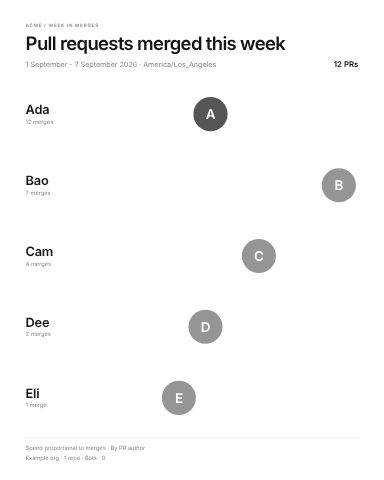
Each author's avatar bounces across their row at a speed set by how many pull requests they merged
4:5 · 16 s · You change: eyebrow, title, period, total…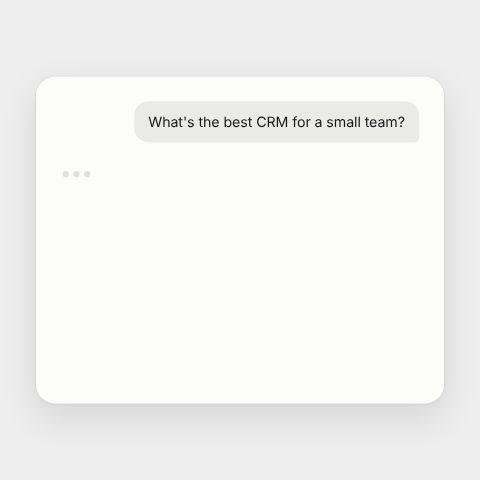
Is your brand in the AI answer? A question types into a chat card, the assistant answers with a ranked list of three picks, then re-ranks: the promoted brand slides into its slot, the picks below step down, and the brand row lands with the one accent highlight and a check. For answer-engine and AI-visibility marketing
1:1 · 9 s · You change: prompt, answer lead-in, pick 1, pick 2…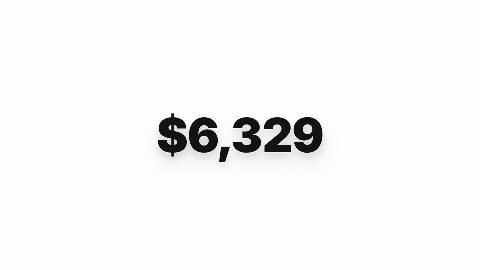
Apple-style finance counter that counts from $0 to $10,000, flashes green, and bursts money icons with sound.
16:9 · 5 s · You change: amount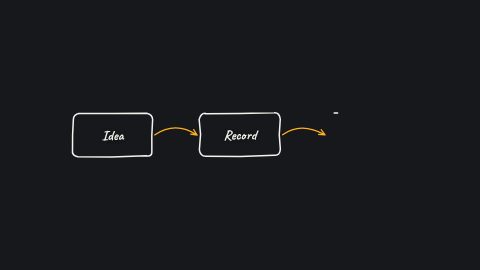
Wobbled boxes with handwritten labels joined by curved connectors, drawing on in sequence from a node list
16:9 · 7 sBlocks marked Ours are UGCLive's. The rest are from HeyGen's open-source HyperFrames registry (Apache-2.0, commit 1c3fcf4), with their authors' descriptions.
| You're saying | Use | You type |
|---|---|---|
| One big figure ("71% of Earth is water") | Count-up stat or progress ring | The number and what it means |
| A ranking or a share | Bar chart | Up to six "Label: number" lines |
| How something changed over time | Line graph or bar chart race | The values in order |
| Before and after, us and them | Comparison | Two sides with their numbers |
| A ranked list | Top 5 countdown | The five items |
In a script video, the planner spots the numbers for you: a sentence with a named figure becomes a count-up, a list of named numbers becomes a bar chart. The world-100-people example below was made that way, scene by scene, from a plain script.
HyperFrames' library adds a full bar chart race, a data chart, a minimal line graph, a count-up stat card, a specs checklist and a leaderboard of the week's merges for developer channels. Each takes its numbers as variables in the Graphics panel.
Add the Count-up stat from Graphics (or ask the chat for one), type the number with its prefix or suffix, like $4.2M or 17%, and render it. It counts from zero to your number and holds it.
Yes: the library's Bar Chart Race block animates ranked bars over time. For a simple ranking our Bar chart takes up to six labels with values.
Our charts use your video's accent, and named colours in a label ("Red: 40") colour that bar. Library charts have their own palettes, with accent-like colours set to yours.
Updated 29 October 2026
Upload a video or paste a script, then say the edit. Our AI makes it on a timeline you can still change.
Try for free