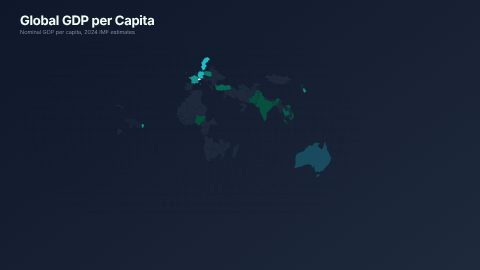
World Map
Animated world choropleth with country-by-country reveal, tooltip labels, and rotating globe inset — D3 Natural Earth projection
16:9 · 14 sTemplates
Where it happened, shown instead of said.
Maps tell the viewer where they are in a story. These templates draw a world, US or Spain map that fills region by region, a bubble map of cities, a flow map of connections, a hex-grid map of states and an annotated map callout, plus a flight route from New York to Paris.

Open Graphics in the editor to change any of them, see it play, and render it into your video.
Animated world choropleth with country-by-country reveal, tooltip labels, and rotating globe inset — D3 Natural Earth projection
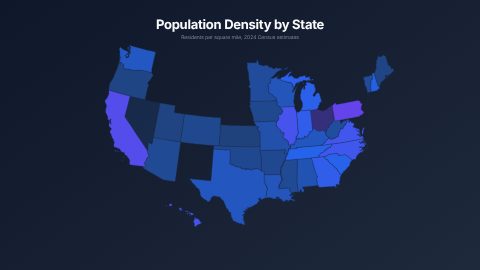
16:9 · 14 sAnimated US choropleth map with staggered state reveals, value labels, and gradient legend — pure inline SVG with GSAP
16:9 · 12 s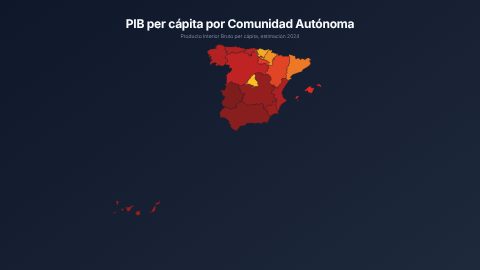
Animated Spain choropleth by autonomous community with staggered reveals and gradient legend — D3 conic conformal projection
16:9 · 12 s
Animated US bubble map with proportional city markers, value callouts, and connection lines — composable with us-map
16:9 · 12 sAnimated connection arcs between US cities over a base map — composable origin-destination flow visualization
16:9 · 12 s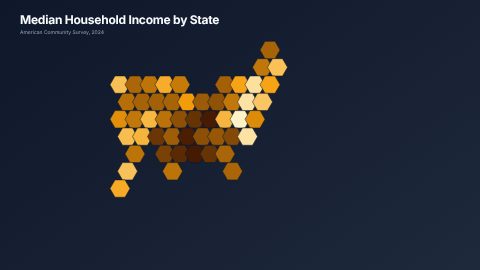
Animated hexagonal tile grid map — each state as an equal-weight hex with data fill and abbreviation label
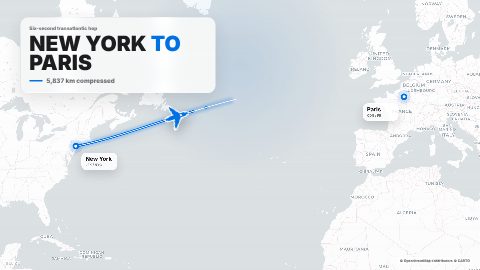
16:9 · 10 sApple-style realistic map animation with a plane flying from New York to Paris, marker circle, landing pop, and sound effects.
16:9 · 6 s · You change: landing badge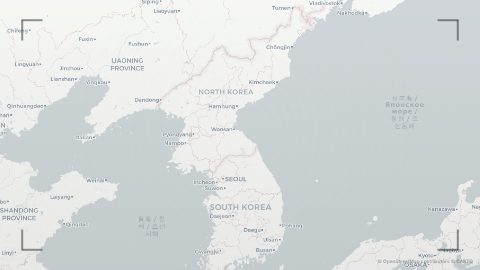
Realistic map zoom into North Korea with a red scribble circle, locked-down pop-up label, and reddish editorial wash.
16:9 · 7 sBlocks marked Ours are UGCLive's. The rest are from HeyGen's open-source HyperFrames registry (Apache-2.0, commit 1c3fcf4), with their authors' descriptions.
| Story | Map |
|---|---|
| A number per country or state | World map, US map, Spain map (choropleth) |
| Where the big cities are | US bubble map |
| Things moving between places | US flow map, NYC to Paris flight |
| Every state the same size | US hex grid map |
| One place called out on the news | Annotated map (North Korea locked down) |
History and geography channels use a map at every change of place. Travel videos open each leg with a route. Explainers and news recaps show where an event happened before showing what happened, which gives the viewer a frame for the rest.
A map works best as a short cutaway of four to ten seconds over the narration, not a long hold.
Open Graphics, choose Charts and numbers or search "map".
The panel plays it exactly as it will render.
It goes over the video at the playhead as a cutaway, only over real footage with room for it.
Not yet: the maps play as their designers drew them, with their own sample data. For your own number per place, our bar chart takes up to six labels with values and reads faster on a phone.
The NYC Paris Flight block draws a flight path between New York and Paris. Other routes aren't a variable yet.
They're drawn 16:9. In a Short they fit or fill the frame; pick whichever keeps the region you need on screen.
Updated 29 October 2026
Upload a video or paste a script, then say the edit. Our AI makes it on a timeline you can still change.
Try for free